11 KiB
11 KiB
遥测服务架构图

部署遥测应用
通过如下docker-compose文件启动应用:
version: '3'
services:
  # 遥测数据采集
  otel:
    image: otel/opentelemetry-collector-contrib
    container_name: otel
    networks:
      - default
      - collector
    ports:
      - 4317:4317
    volumes:
      - ./etc/otel/otel-collector-config.yaml:/etc/otelcol-contrib/config.yaml
    restart: unless-stopped
  # 踪迹存储,可替换为jaeger
  tempo:
    image: grafana/tempo
    container_name: tempo
    networks:
      - default
    volumes:
      - ./etc/tempo/tempo.yaml:/etc/tempo/config.yml
      - ./data/tempo:/data/tempo
    command: ["-config.file=/etc/tempo/config.yml"]
    restart: unless-stopped
  # 日志存储,可替换为ElasticSearch
  loki:
    image: grafana/loki
    container_name: loki
    networks:
      - default
    volumes:
      - ./etc/loki/local-config.yaml:/etc/loki/local-config.yaml
      - ./data/loki:/data/loki
    restart: unless-stopped
  # 指标存储
  prometheus:
    image: prom/prometheus
    container_name: prometheus
    networks:
      - default
    extra_hosts:
      - "host.docker.internal:host-gateway"
    volumes:
      - ./etc/prometheus/prometheus.yml:/etc/prometheus/prometheus.yml
      - ./data/prometheus:/prometheus
    restart: unless-stopped
  # 可视化
  grafana:
    image: grafana/grafana-oss
    container_name: grafana
    networks:
      - default
    # For more information on this configuration, see the complete reference guide at
    # https://grafana.com/docs/grafana/latest/setup-grafana/configure-grafana/
    enviroment:
      # Run Grafana behind a reverse proxy
      # https://grafana.com/tutorials/run-grafana-behind-a-proxy/
      - GF_SERVER_DOMAIN=https://www.rzdata.net
      - GF_SERVER_ROOT_URL = %(protocol)s://%(domain)s/grafana/
      - GF_SERVER_SERVE_FROM_SUB_PATH=true
    ports:
      - 3000:3000
    volumes:
      - ./data/grafana:/var/lib/grafana
    restart: unless-stopped

networks:
  default:
    driver: bridge
  collector:
    driver: bridge
tempo配置文件:
# For more information on this configuration, see the complete reference guide at
# https://grafana.com/docs/tempo/latest/configuration/

stream_over_http_enabled: true

# Configure the server block.
server:
  # Listen for all incoming requests on port 3200.
  http_listen_port: 3200

# The distributor receives incoming trace span data for the system.
distributor:
  receivers:             # This configuration will listen on all ports and protocols that tempo is capable of.
    otlp:
      protocols:
        grpc:            # This example repository only utilises the OTLP gRPC receiver on port 4317.

# The ingester receives data from the distributor and processes it into indices and blocks.
ingester:
  trace_idle_period: 10s       # The length of time after a trace has not received spans to consider it complete and flush it.
  max_block_bytes: 1_000_000   # Cut the head block when it hits this size or
  max_block_duration: 5m       # this much time passes

# The compactor block configures the compactor responsible for compacting TSDB blocks.
compactor:
  compaction:
    compaction_window: 1h              # Blocks in this time window will be compacted together.
    max_block_bytes: 100_000_000       # Maximum size of a compacted block.
    block_retention: 1h                # How long to keep blocks. Default is 14 days, this demo system is short-lived.
    compacted_block_retention: 10m     # How long to keep compacted blocks stored elsewhere.

# Configuration block to determine where to store TSDB blocks.
storage:
  trace:
    backend: local                     # Use the local filesystem for block storage. Not recommended for production systems.
    block:
      bloom_filter_false_positive: .05 # Bloom filter false positive rate.  lower values create larger filters but fewer false positives.
    # Write Ahead Log (WAL) configuration.
    wal:
      path: /data/tempo/wal             # Directory to store the the WAL locally.
    # Local configuration for filesystem storage.
    local:
      path: /data/tempo/blocks          # Directory to store the TSDB blocks.
    # Pool used for finding trace IDs.
    pool:
      max_workers: 100                 # Worker pool determines the number of parallel requests to the object store backend.
      queue_depth: 10000               # Maximum depth for the querier queue jobs. A job is required for each block searched.

# Configures the metrics generator component of Tempo.
metrics_generator:
  # Specifies which processors to use.
  processor:
    # Span metrics create metrics based on span type, duration, name and service.
    span_metrics:
        # Configure extra dimensions to add as metric labels.
        dimensions:
          - http.method
          - http.target
          - http.status_code
          - service.version
    # Service graph metrics create node and edge metrics for determinng service interactions.
    service_graphs:
        # Configure extra dimensions to add as metric labels.
        dimensions:
          - http.method
          - http.target
          - http.status_code
          - service.version
  # The registry configuration determines how to process metrics.
  registry:
    collection_interval: 5s                 # Create new metrics every 5s.
    # Configure extra labels to be added to metrics.
    external_labels:
      source: tempo                         # Add a `{source="tempo"}` label.
      group: 'mythical'                     # Add a `{group="mythical"}` label.
  # Configures where the store for metrics is located.
  storage:
    # WAL for metrics generation.
    path: /data/tempo/generator/wal
  traces_storage:
    path: /data/tempo/generator/traces

# Global override configuration.
overrides:
  metrics_generator_processors: ['service-graphs', 'span-metrics','local-blocks'] # The types of metrics generation to enable for each tenant.
loki配置文件:
# For more information on this configuration, see the complete reference guide at
# https://grafana.com/docs/loki/latest/configure/

auth_enabled: false

server:
  http_listen_port: 3100
  grpc_listen_port: 9096

common:
  instance_addr: 127.0.0.1
  path_prefix: /data/loki
  storage:
    filesystem:
      chunks_directory: /data/loki/chunks
      rules_directory: /data/loki/rules
  replication_factor: 1
  ring:
    kvstore:
      store: inmemory

query_range:
  results_cache:
    cache:
      embedded_cache:
        enabled: true
        max_size_mb: 100

schema_config:
  configs:
    - from: 2020-10-24
      store: tsdb
      object_store: filesystem
      schema: v12
      index:
        prefix: index_
        period: 24h

ruler:
  alertmanager_url: http://localhost:9093
prometheus配置文件:
# For more information on this configuration, see the complete reference guide at
# https://prometheus.io/docs/prometheus/latest/configuration/configuration/

global:
  scrape_interval: 15s

scrape_configs:
- job_name: aggregated-trace-metrics
  static_configs:
  - targets: ['otel:8889']
opentelemetry collector配置文件:
# For more information on this configuration, see the complete reference guide at
# https://opentelemetry.io/docs/collector/configuration/

receivers:
  otlp:
    protocols:
      grpc:

processors:
  batch:

connectors:
  spanmetrics:
    dimensions:
      - name: http.method # extract http.method attribute from span to Prometheus label http_method
      - name: http.status_code  # extract http.status_code attribute from span to Prometheus label http_status_code
      - name: http.route  # extract http.route attribute from span to Prometheus label http_route

exporters:
  debug:
  otlp/tempo:
    endpoint: tempo:4317
    tls:
      insecure: true
  loki:
    endpoint: http://loki:3100/loki/api/v1/push
  prometheusremotewrite:
    endpoint: http://prometheus:9090/api/v1/write
  prometheus:
    endpoint: "0.0.0.0:8889"

service:
  pipelines:
    traces:
      receivers: [otlp]
      processors: [batch]
      exporters: [debug, spanmetrics, otlp/tempo]
    logs:
      receivers: [otlp]
      processors: [batch]
      exporters: [debug, loki]
    metrics:
      receivers: [otlp]
      processors: [batch]
      exporters: [debug, prometheus]
    metrics/spanmetrics:
      receivers: [spanmetrics]
      exporters: [debug, prometheus]
后端服务收集遥测数据
分别下载 opentelemetry-javaagent.jar 和 ot-java-agent-extension-1.28.0.jar 放在 /opt/agent 目录。然后用以下命令启动应用:
# For more information on this configuration, see the complete reference guide at
# https://github.com/open-telemetry/opentelemetry-java/tree/main/sdk-extensions/autoconfigure

java -javaagent:/opt/agent/opentelemetry-javaagent.jar \
 -Dotel.javaagent.extensions=/opt/agent/ot-java-agent-extension-1.28.0.jar \
 -Dotel.exporter.otlp.endpoint=http://otel:4317 \
 -Dotel.service.name=xxx \
 -Dotel.logs.exporter=otlp \
 -jar xxx.jar
opentelemetry-javaagent 会对一些库自动记录 Span,如果想要追加一些 Span 以便更精细地追踪,则需要通过注解来控制:
<dependencies>
  <dependency>
    <groupId>io.opentelemetry.instrumentation</groupId>
    <artifactId>opentelemetry-instrumentation-annotations</artifactId>
    <version>1.32.0</version>
  </dependency>
</dependencies>
import io.opentelemetry.instrumentation.annotations.WithSpan;

/**
 * @see <a href="https://opentelemetry.io/docs/instrumentation/java/automatic/annotations/">Annotations | OpenTelemetry</a>
 */
public class MyClass {
  @WithSpan
  public void myMethod() {
      <...>
  }
}
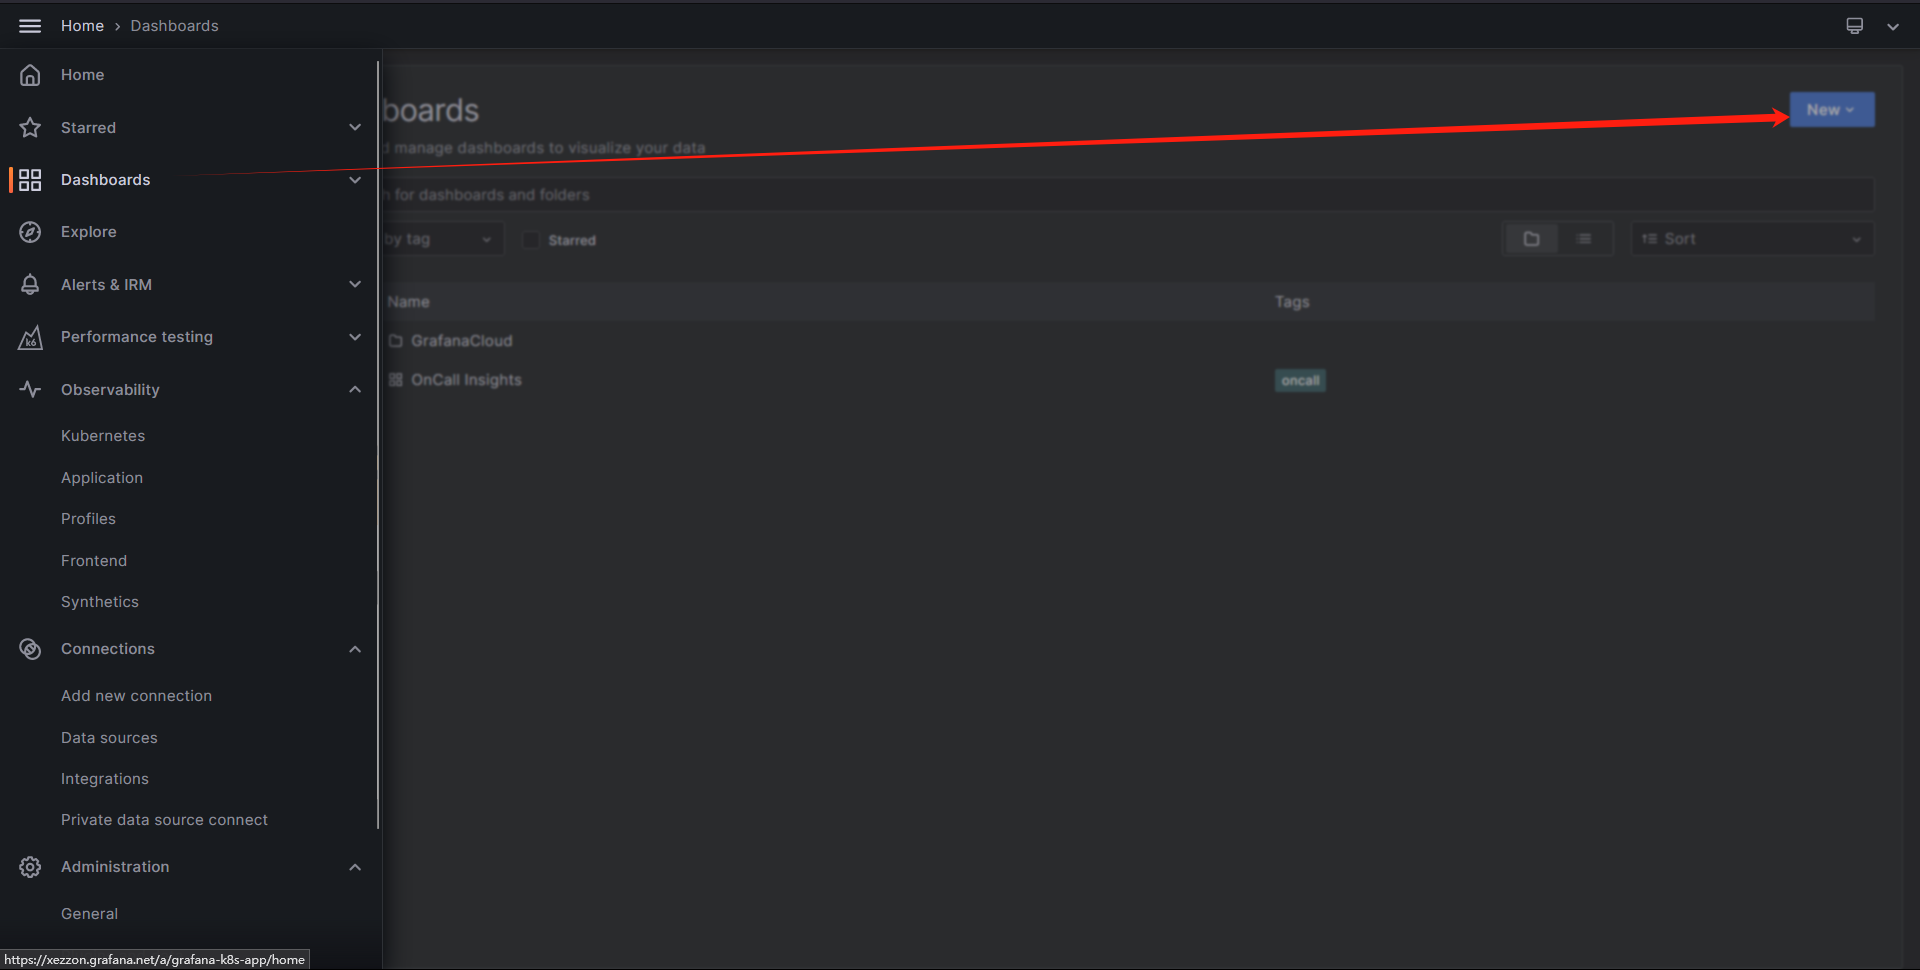
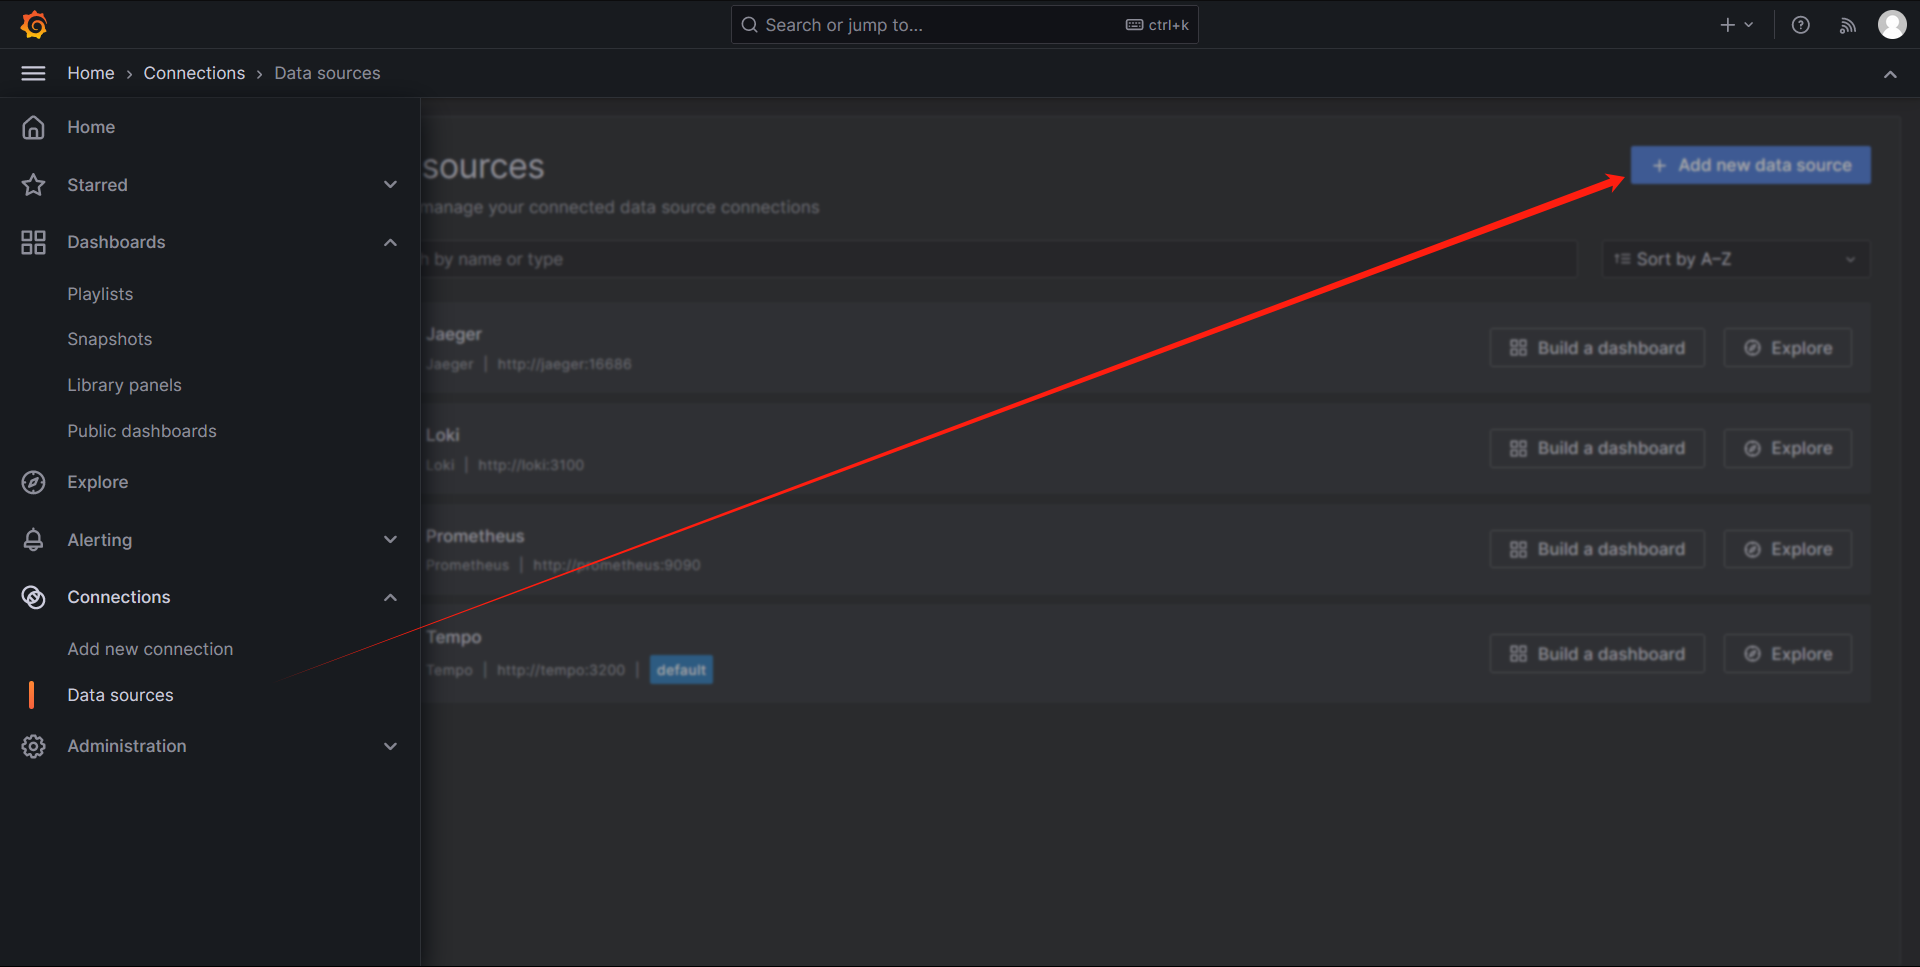
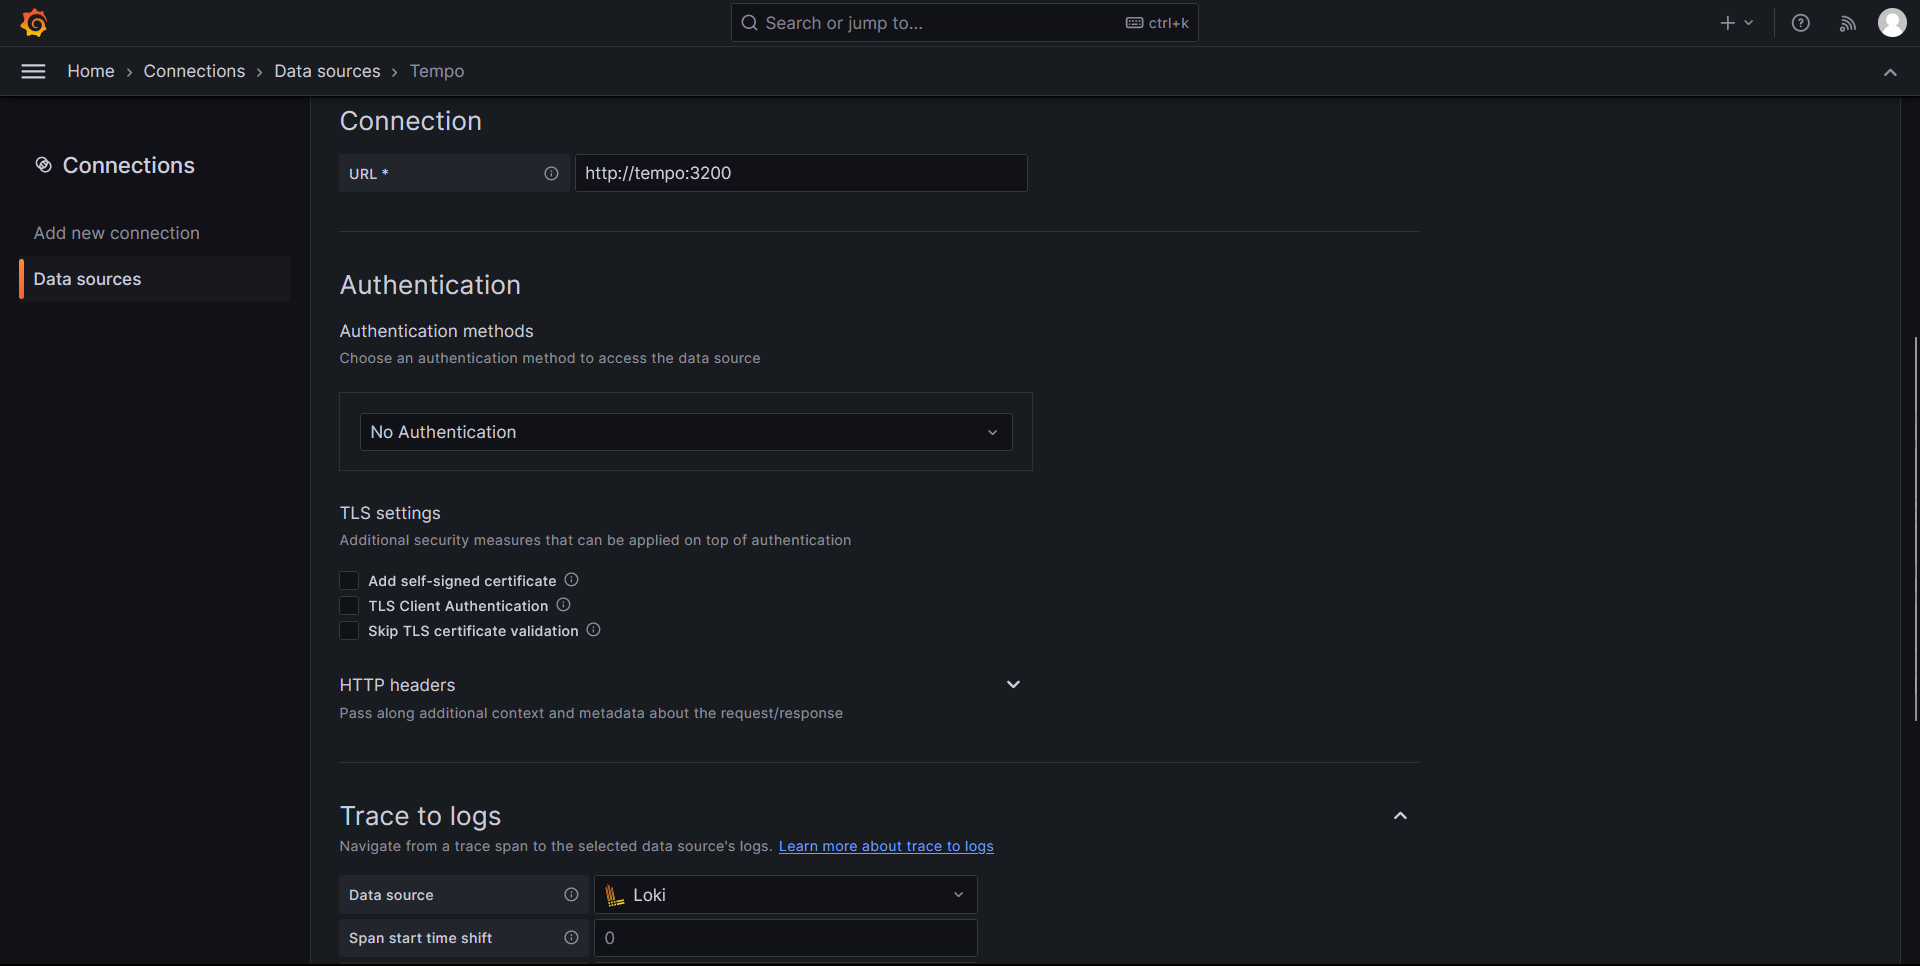
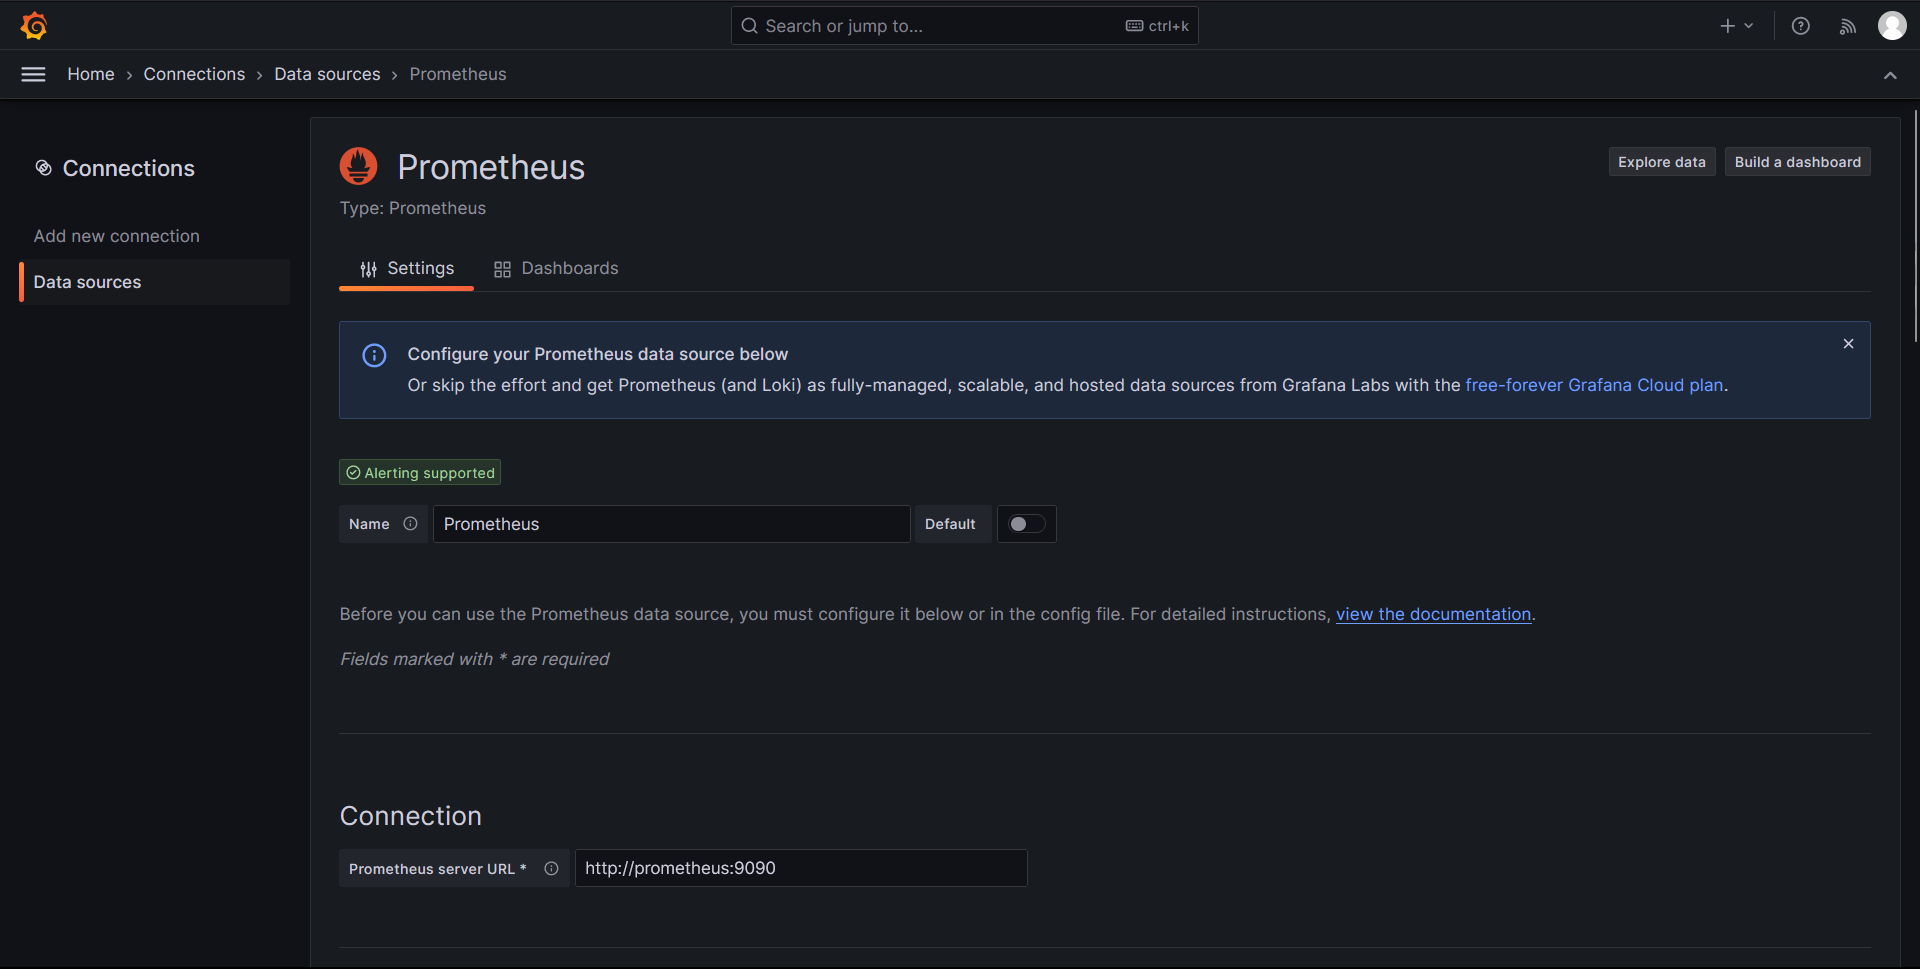
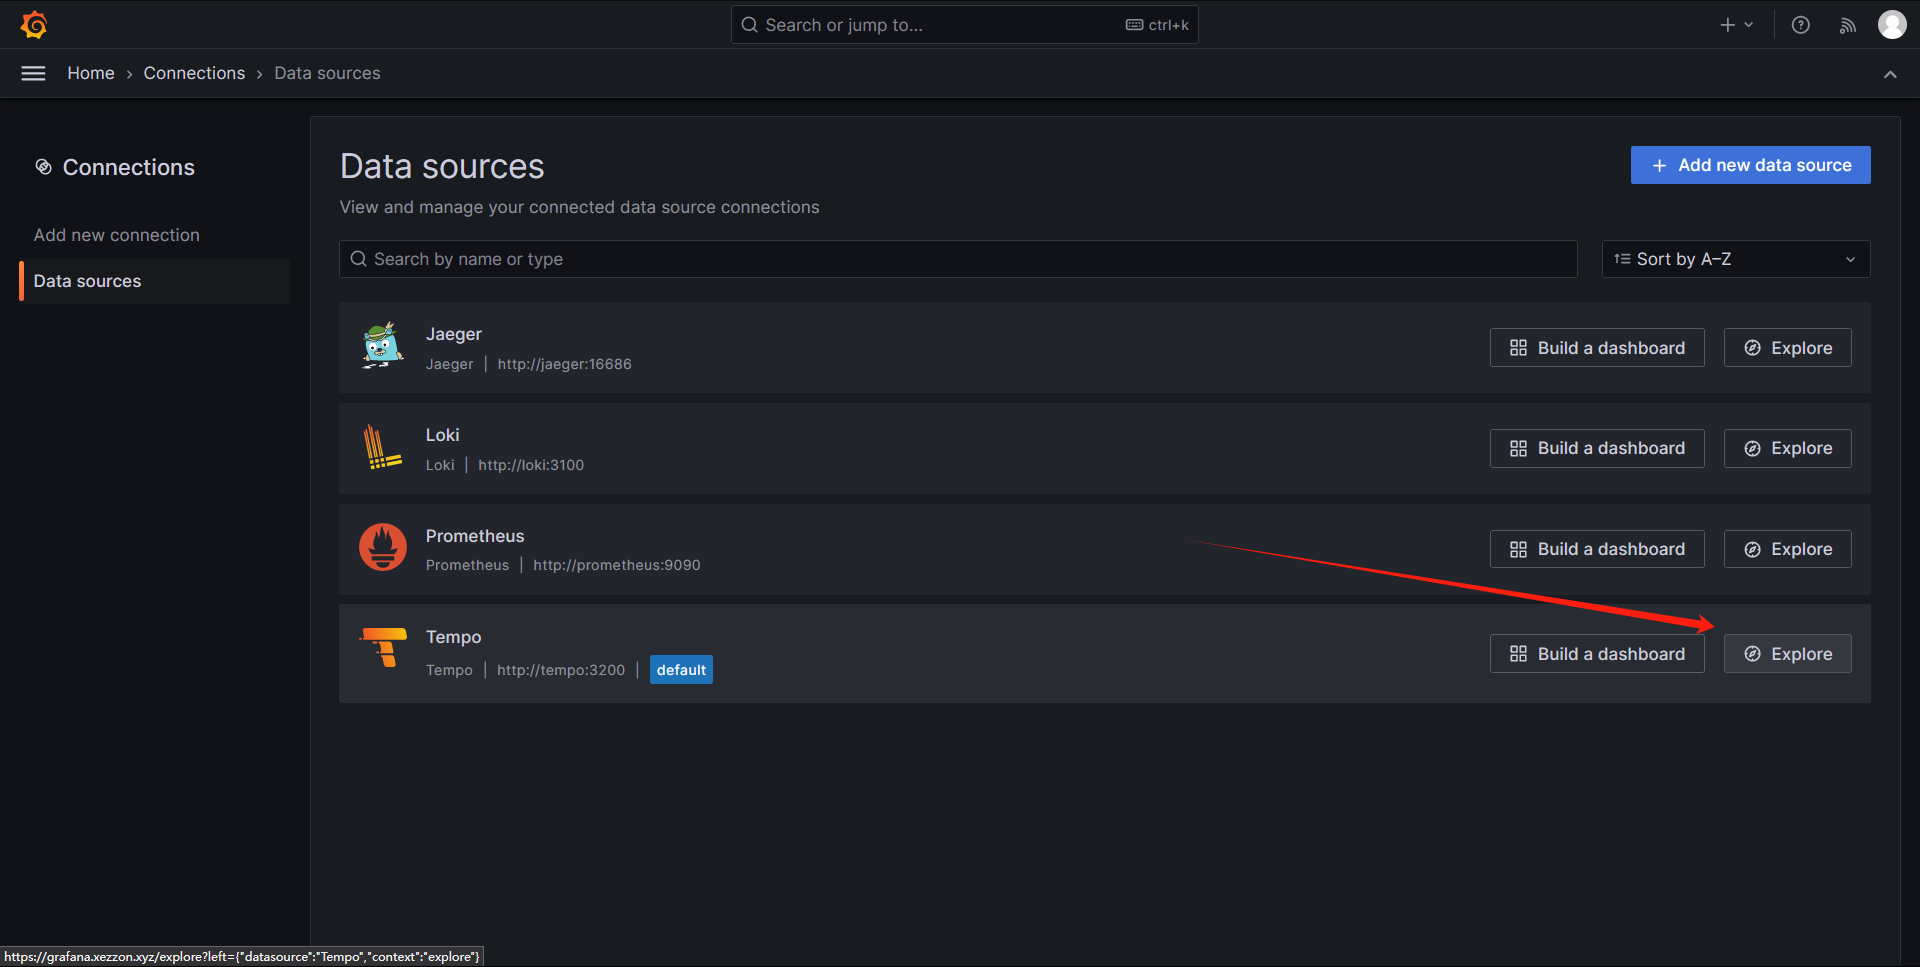
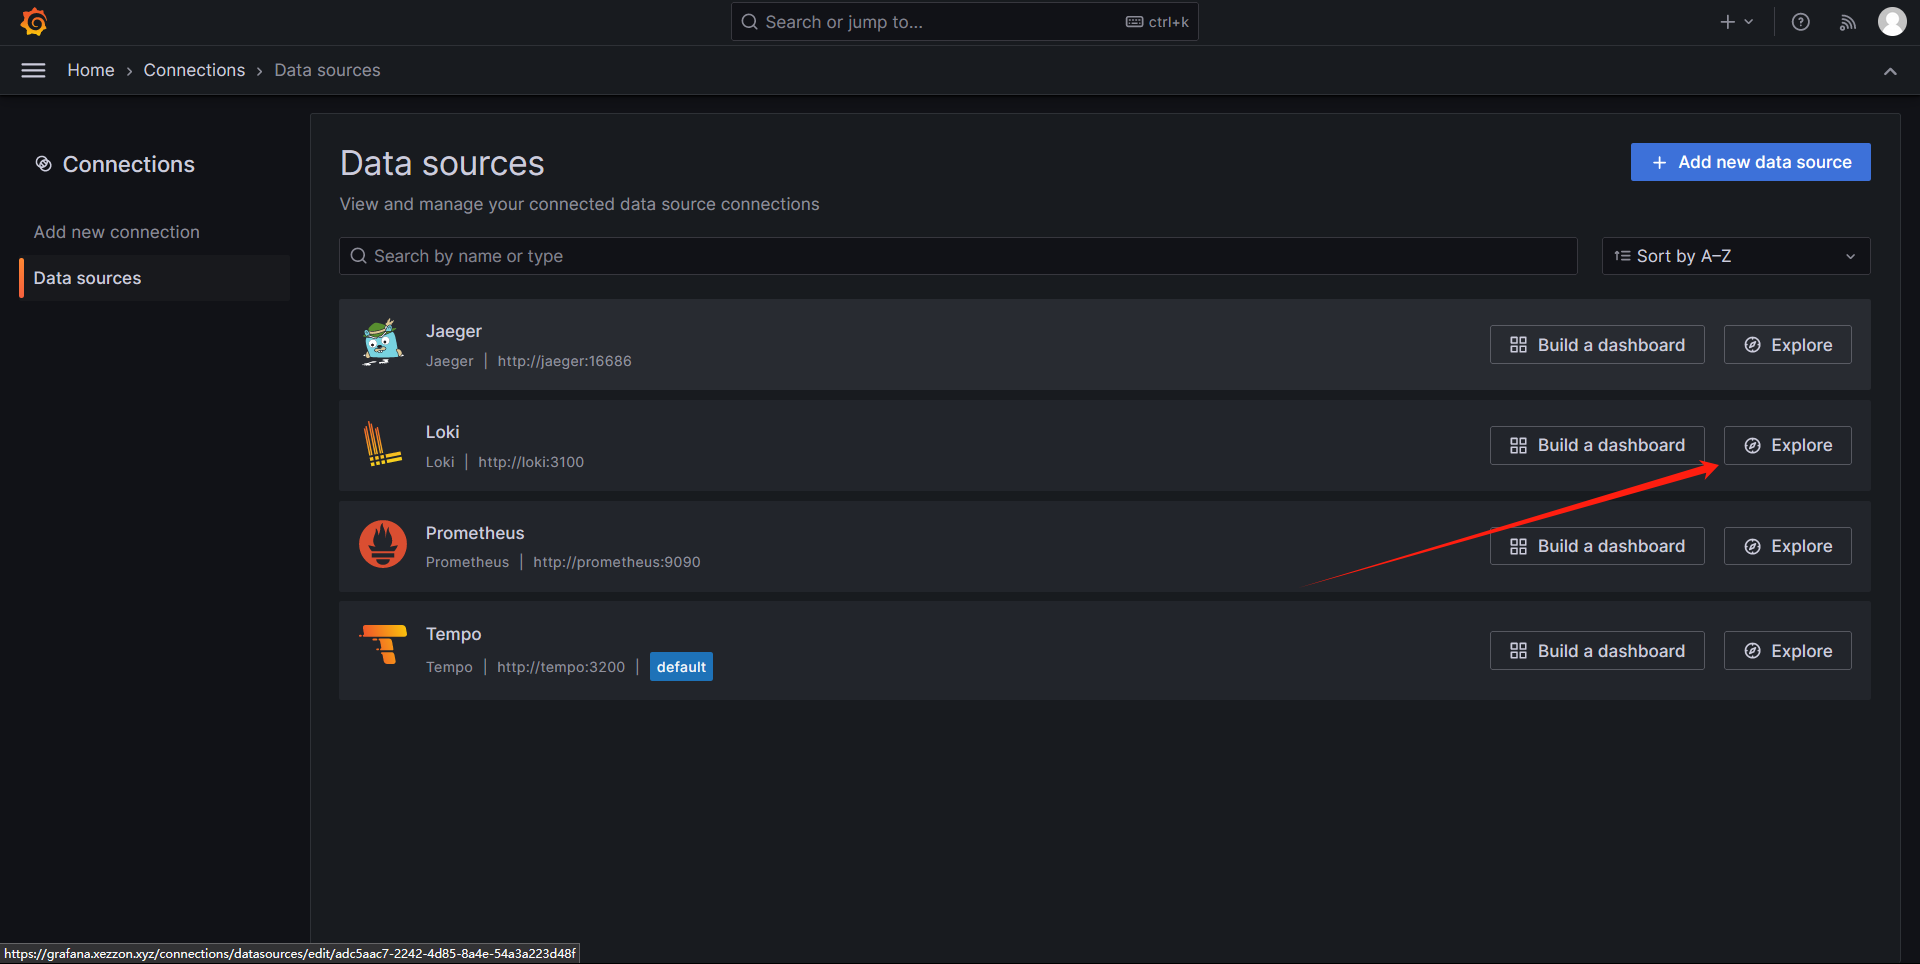
可视化遥测数据
访问https://www.rzdata.net/grafana/。添加数据源:
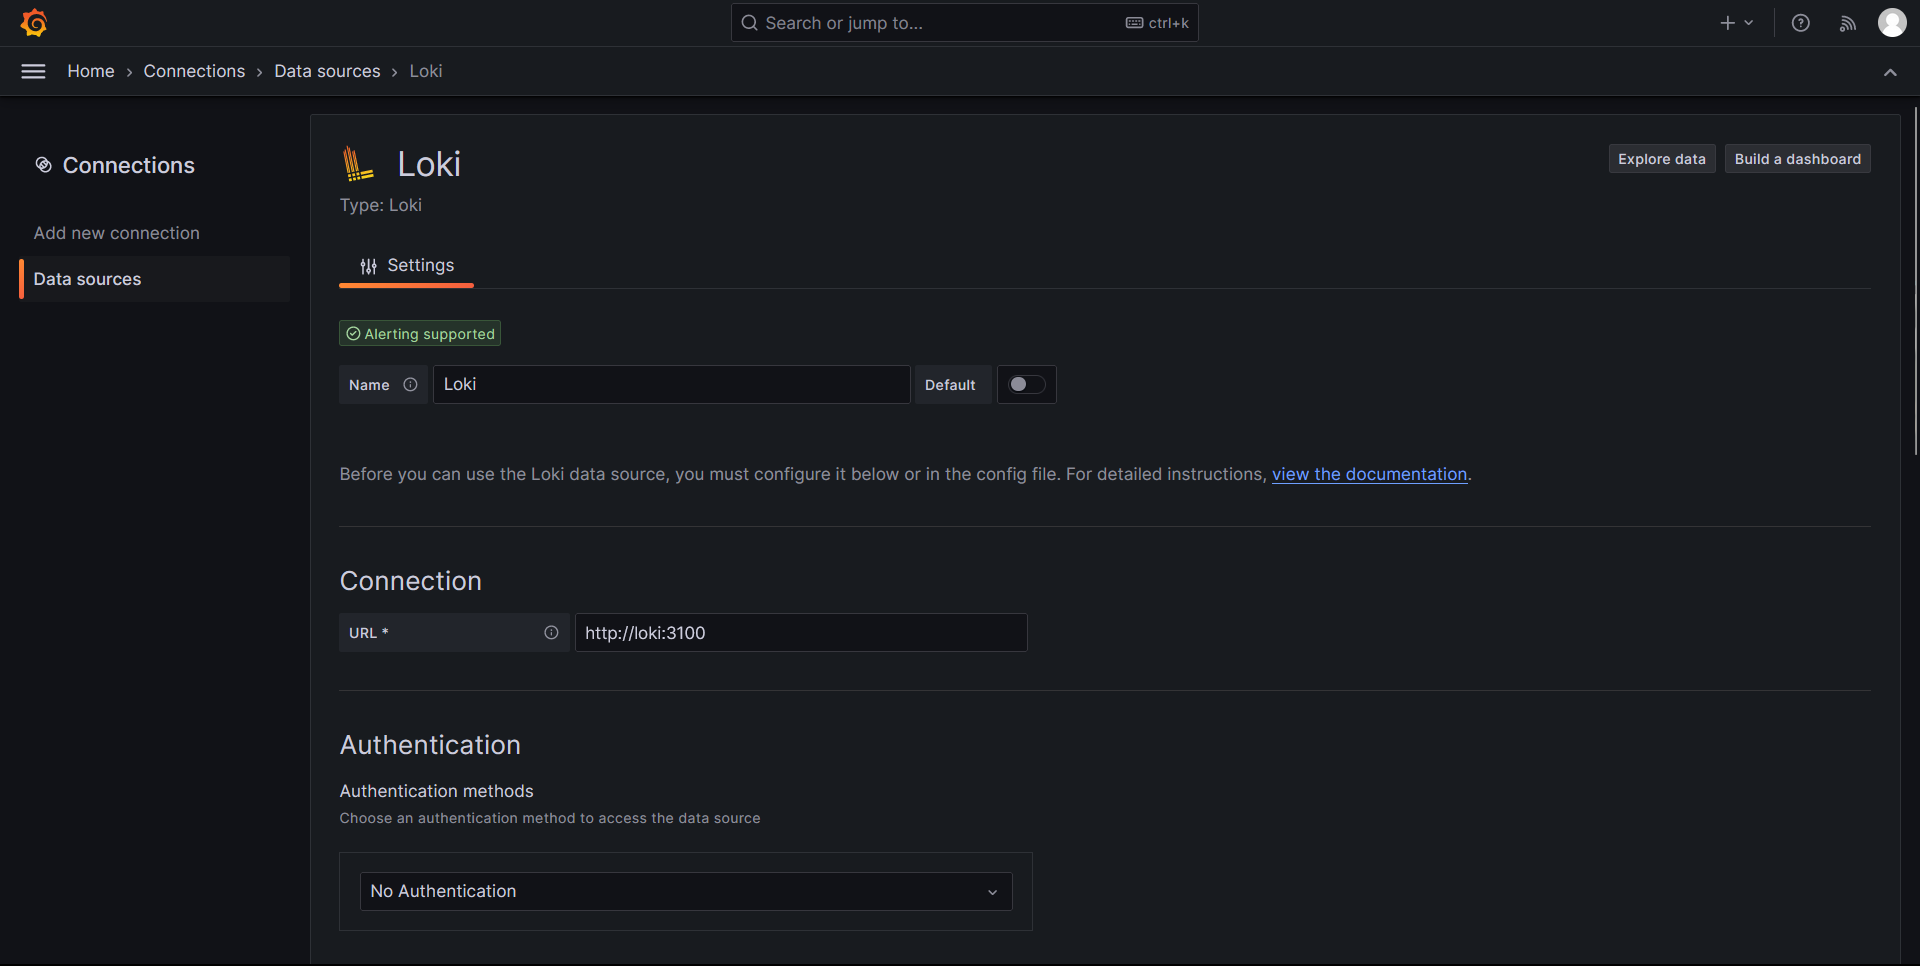
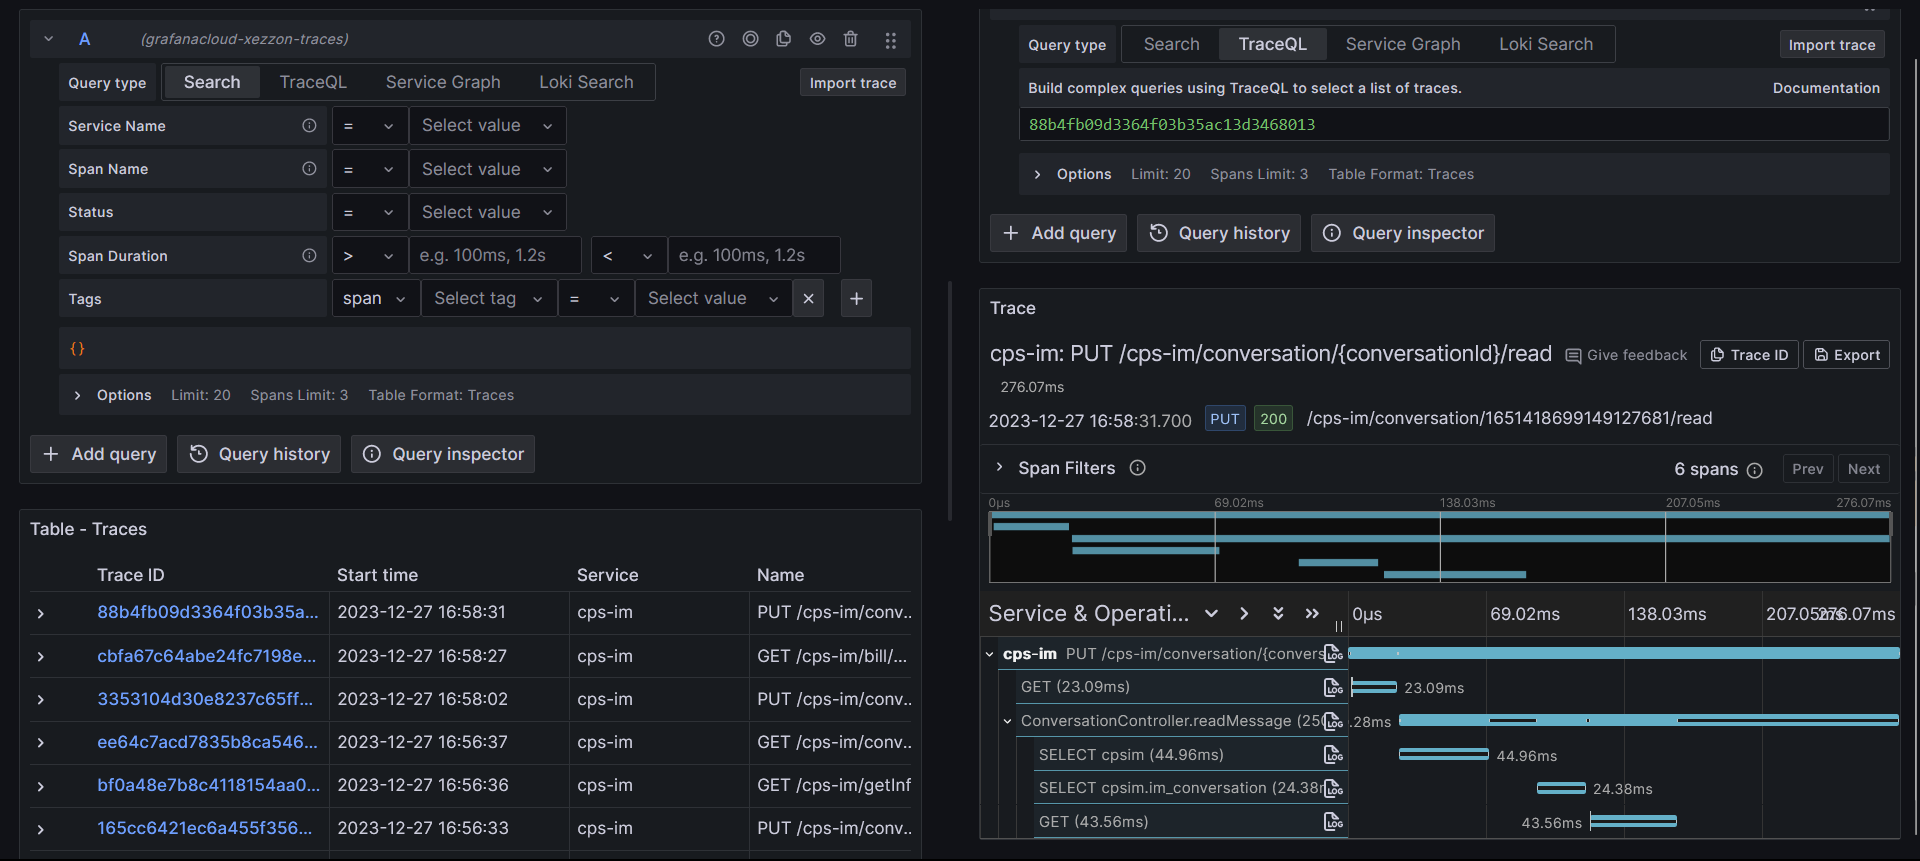
查看踪迹
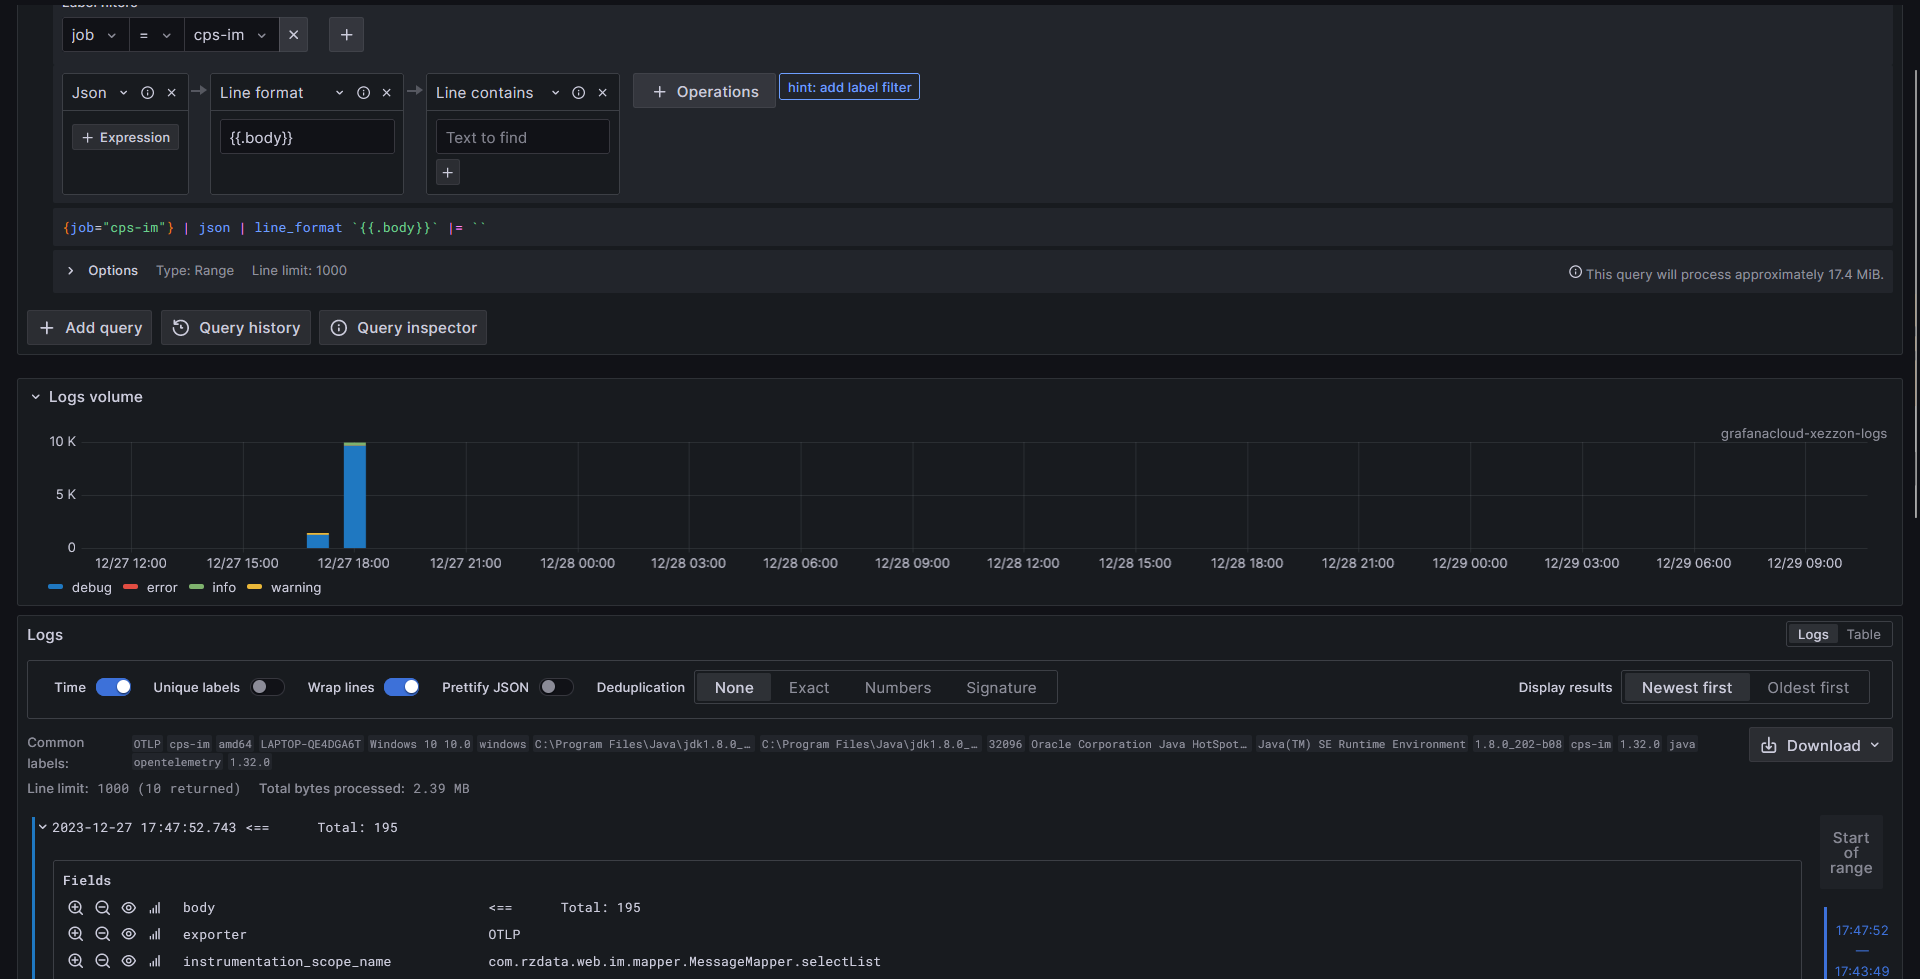
查看日志
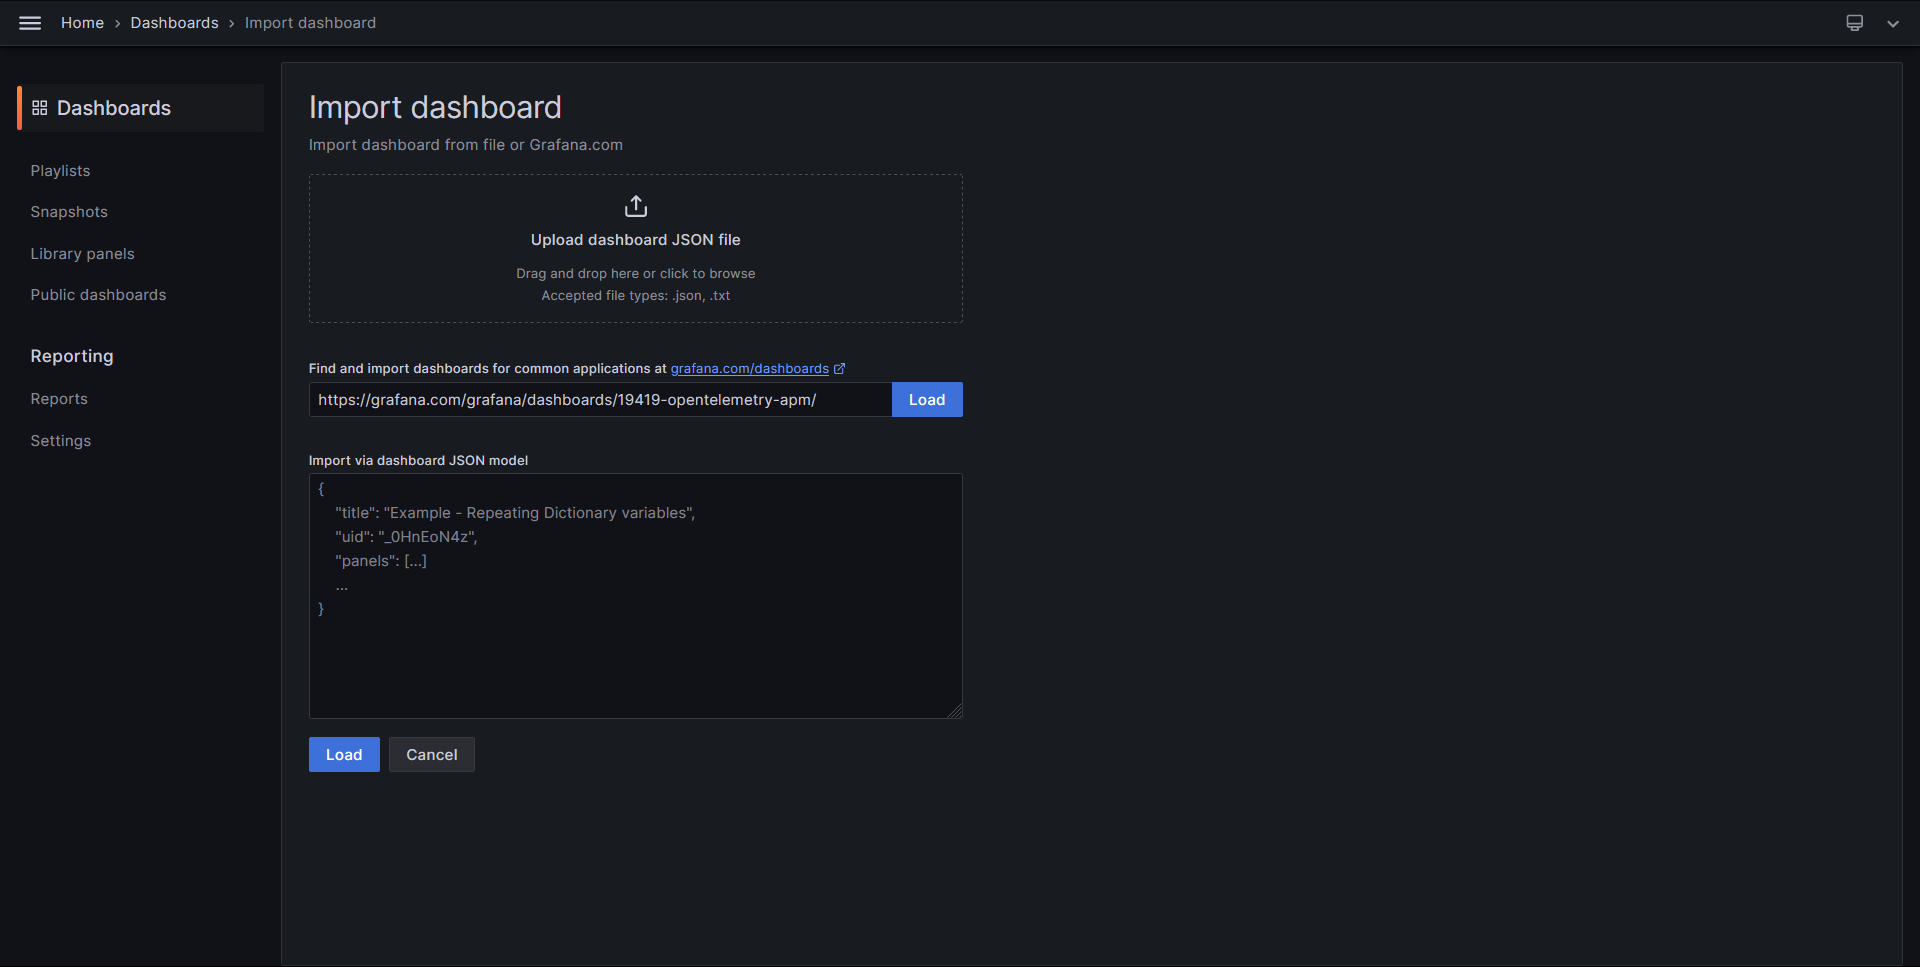
查看指标
指标的配置比较复杂,可以在 Grafana Dashboard Market 找到现成的 Dashboard 来使用。这里可以尝试 OpenTelemetry APM。